Documents / Alder Court
A sample offering memorandum,
page by page.
A complete 12-page retail OM, from the cover to the rent roll and operating statement. Open each page below to see how the information fits together.
- Property type
- Neighborhood retail
- Rentable area
- 18,000 SF
- Occupied suites
- 5 of 6
- Document
- 12 pages
Page 01 / 12
Cover
Identify the property immediately.
Alder Court’s cover brings the courtyard image together with the asking price, rentable area, occupancy, and in-place cap rate.
The property name, location, and main figures should be readable at a glance.
Open page 1 in the PDF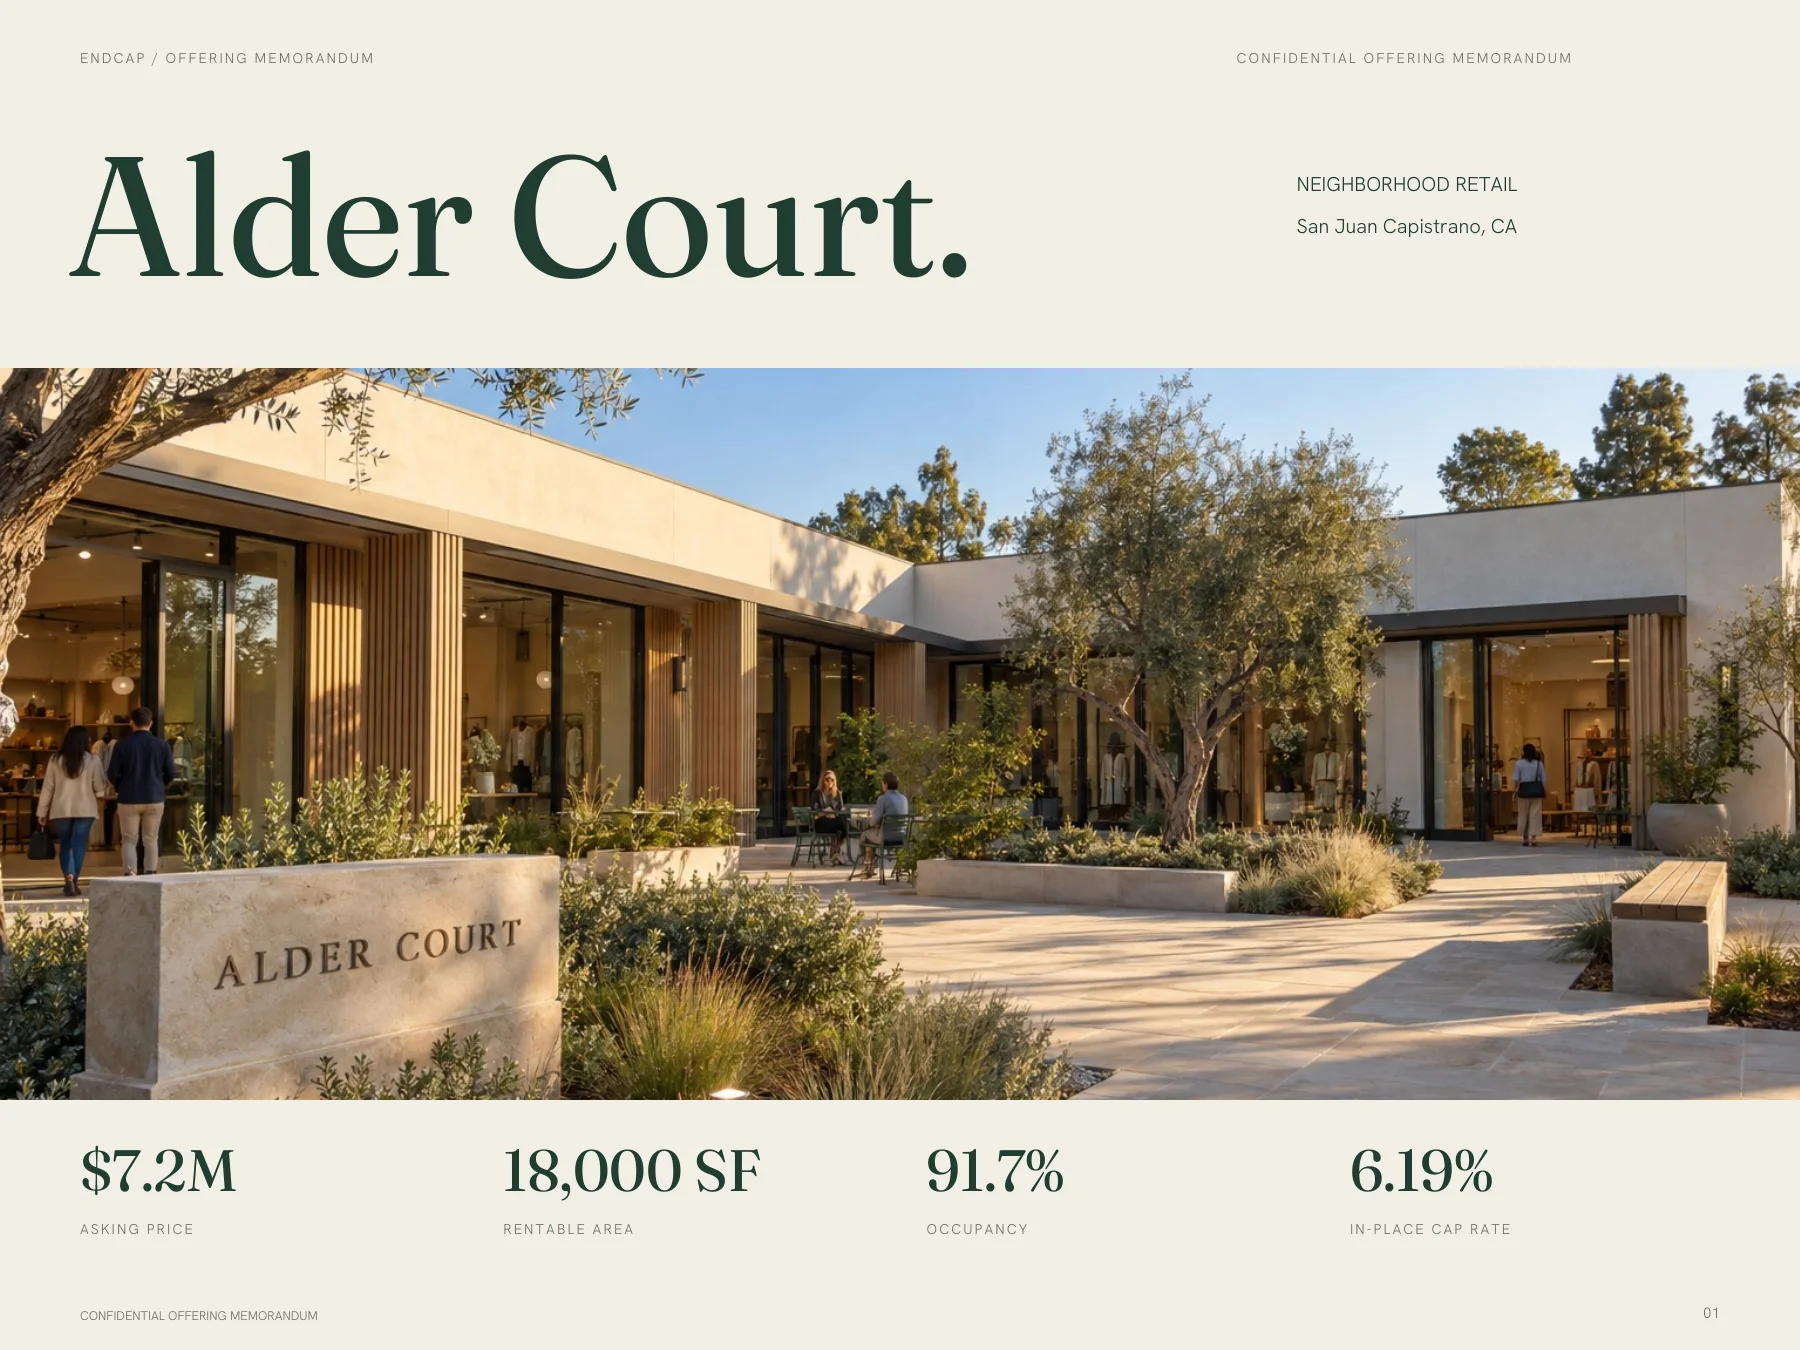
Page 02 / 12
Investment summary
Put the main figures together.
The example describes an 18,000 SF center with five occupied suites and one available suite. Annual in-place NOI is $446,000; asking price is $7.2 million. The page also shows price per square foot and the area-weighted remaining lease term.
Use a concise property description and figures that reconcile with the later tables.
Open page 2 in the PDF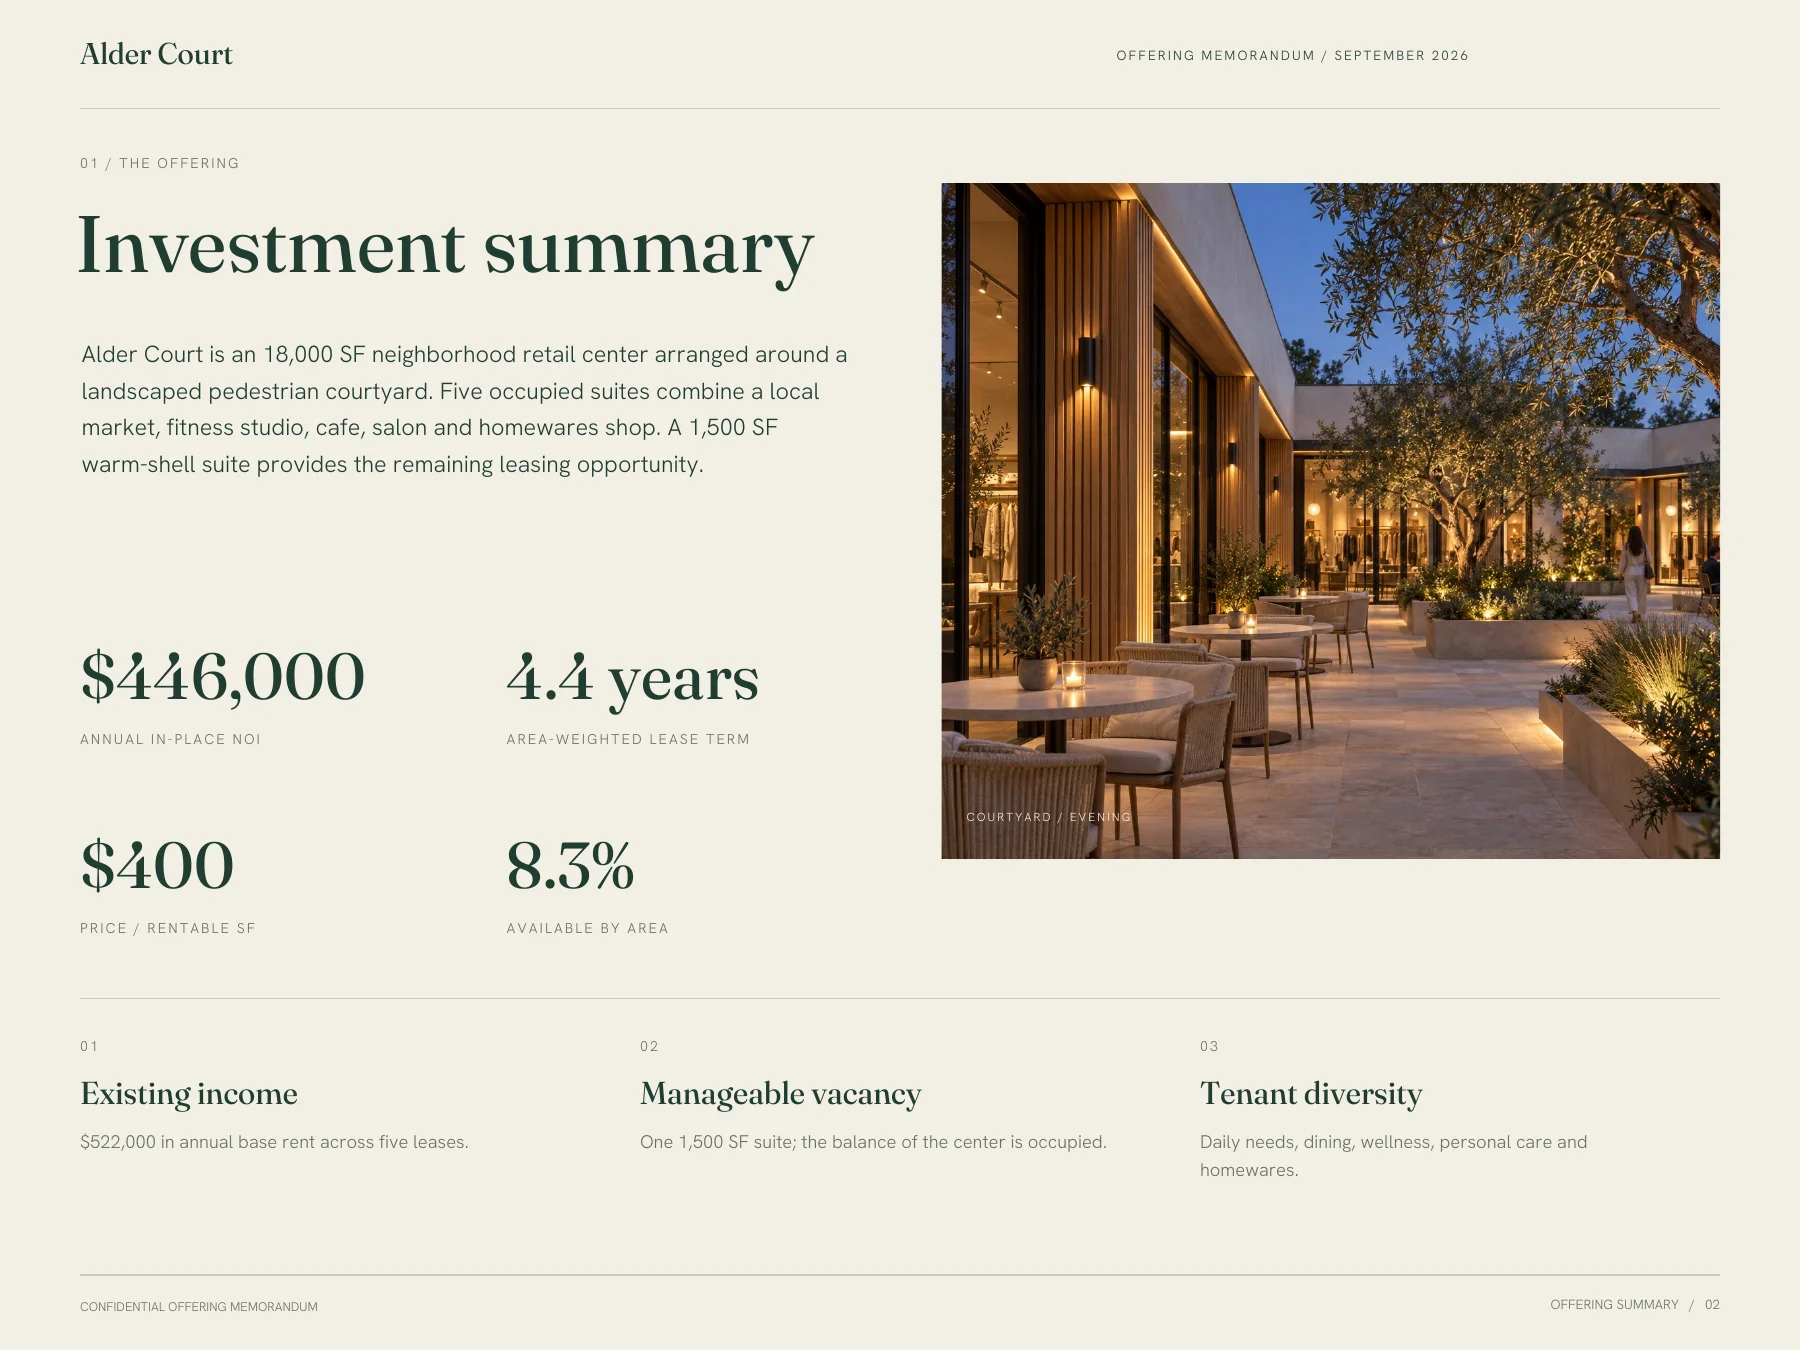
Page 03 / 12
Property overview
Show the physical setting.
An aerial sits beside the building facts: rentable area, land area, suite count, parking, and construction dates. These details belong together so a reader can compare the image with the schedule.
In a live assignment, use verified property records and approved photography.
Open page 3 in the PDF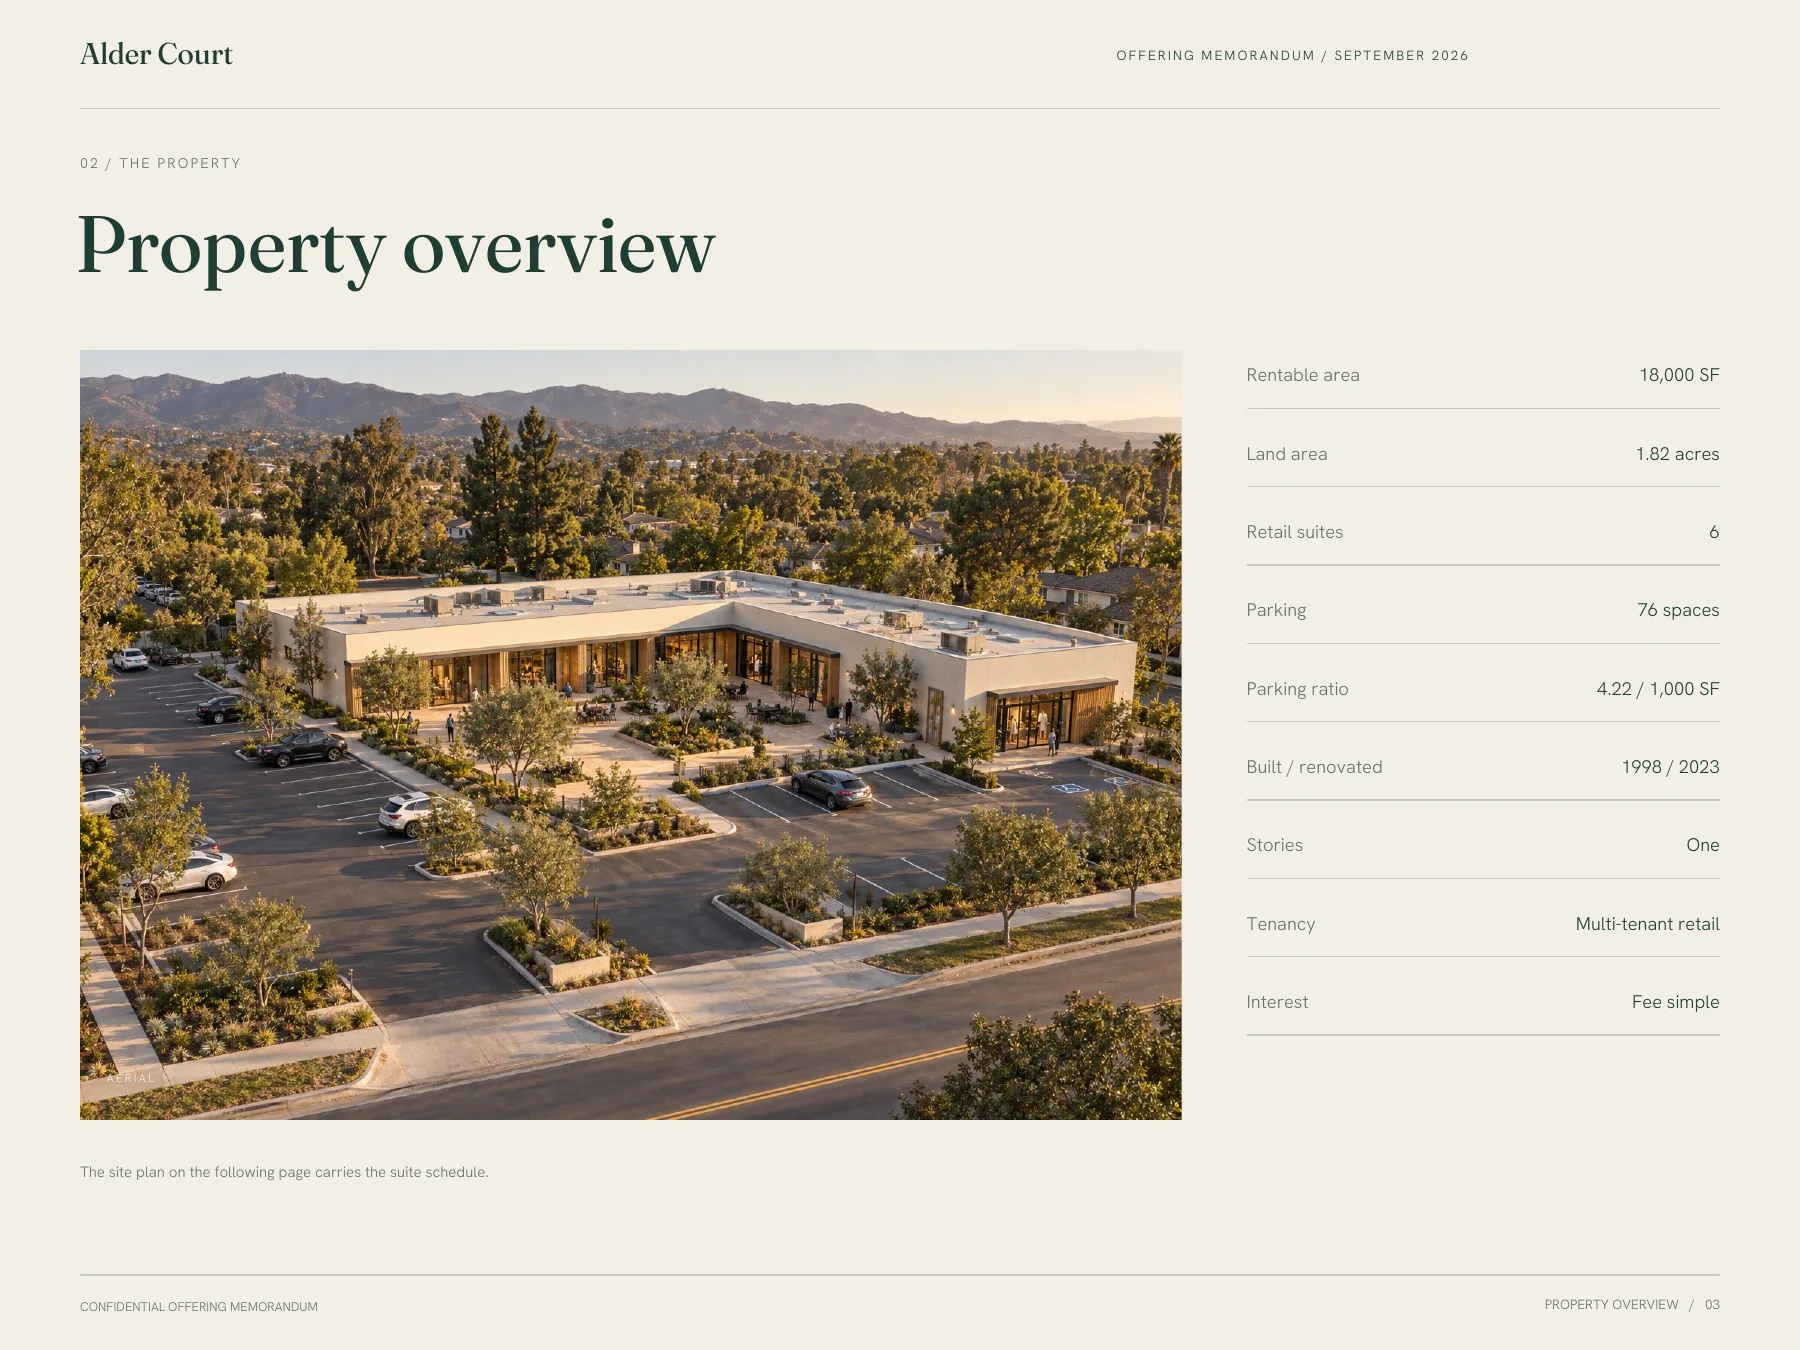
Page 04 / 12
Site plan
Connect every suite to the rent roll.
The conceptual plan labels suites A through F and pairs them with the same tenant names and areas used in the rent roll. Suite F is the 1,500 SF vacancy.
Plans should come from an approved source, such as the owner’s survey or architect.
Open page 4 in the PDF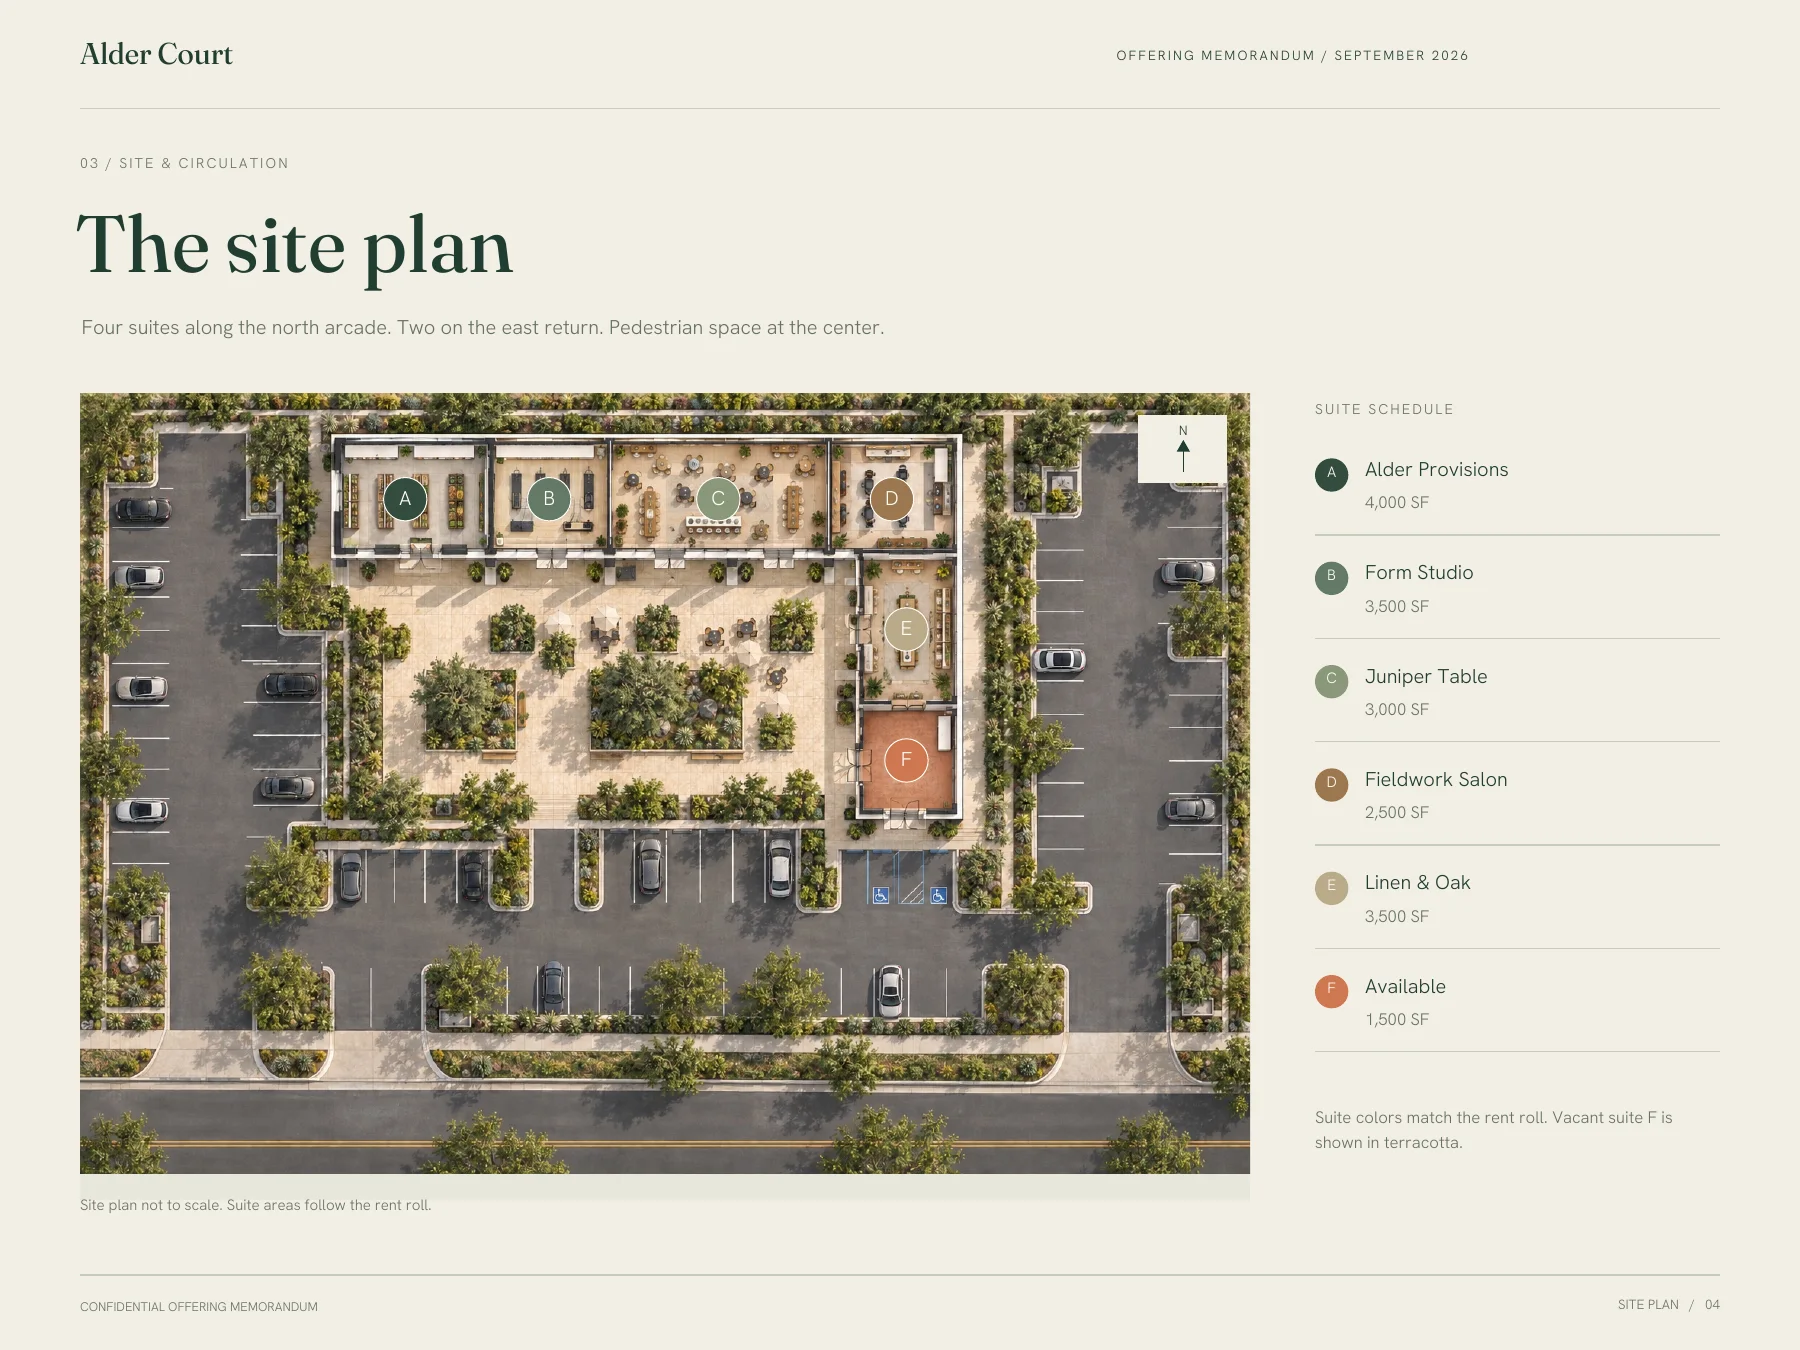
Page 05 / 12
Location & demographics
Give the map and figures a clear geography.
Page 5 uses an actual South Orange County map and compares San Juan Capistrano with Orange County. Income, households, household size, homeownership, home values, and rent are aligned in one table.
These are sourced city and county statistics, not 1-, 3-, or 5-mile figures around a property. No subject parcel is represented.
Open page 5 in the PDF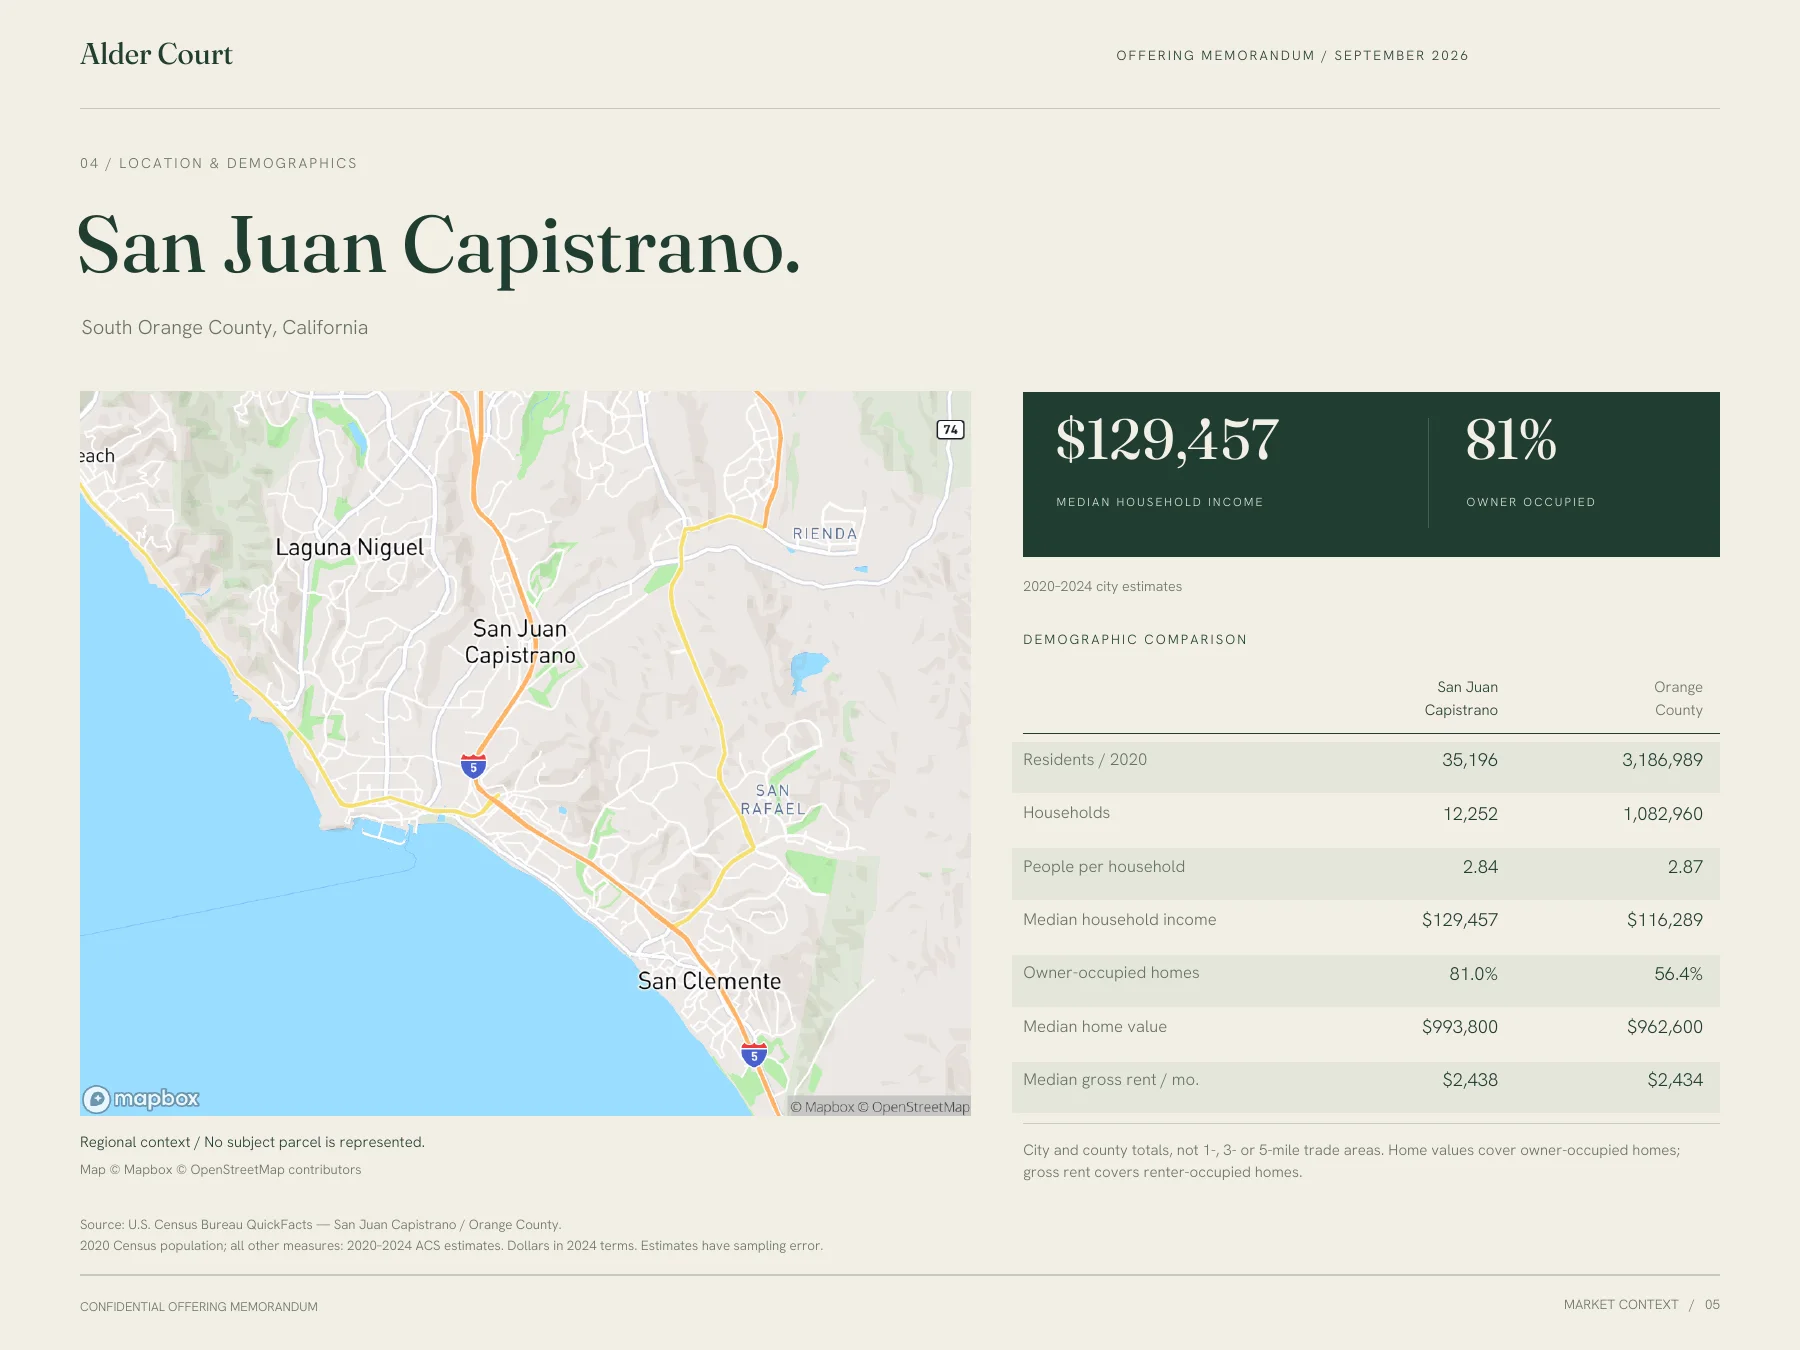
Page 06 / 12
Tenant mix
Show how the space is used.
Five tenants represent a neighborhood market, Pilates studio, cafe, salon, and homewares shop. Each suite has a consistent letter, color, use, and area; the available suite is included in the same system.
Keep the suite labels consistent across the plan, tenant schedule, and financial pages.
Open page 6 in the PDF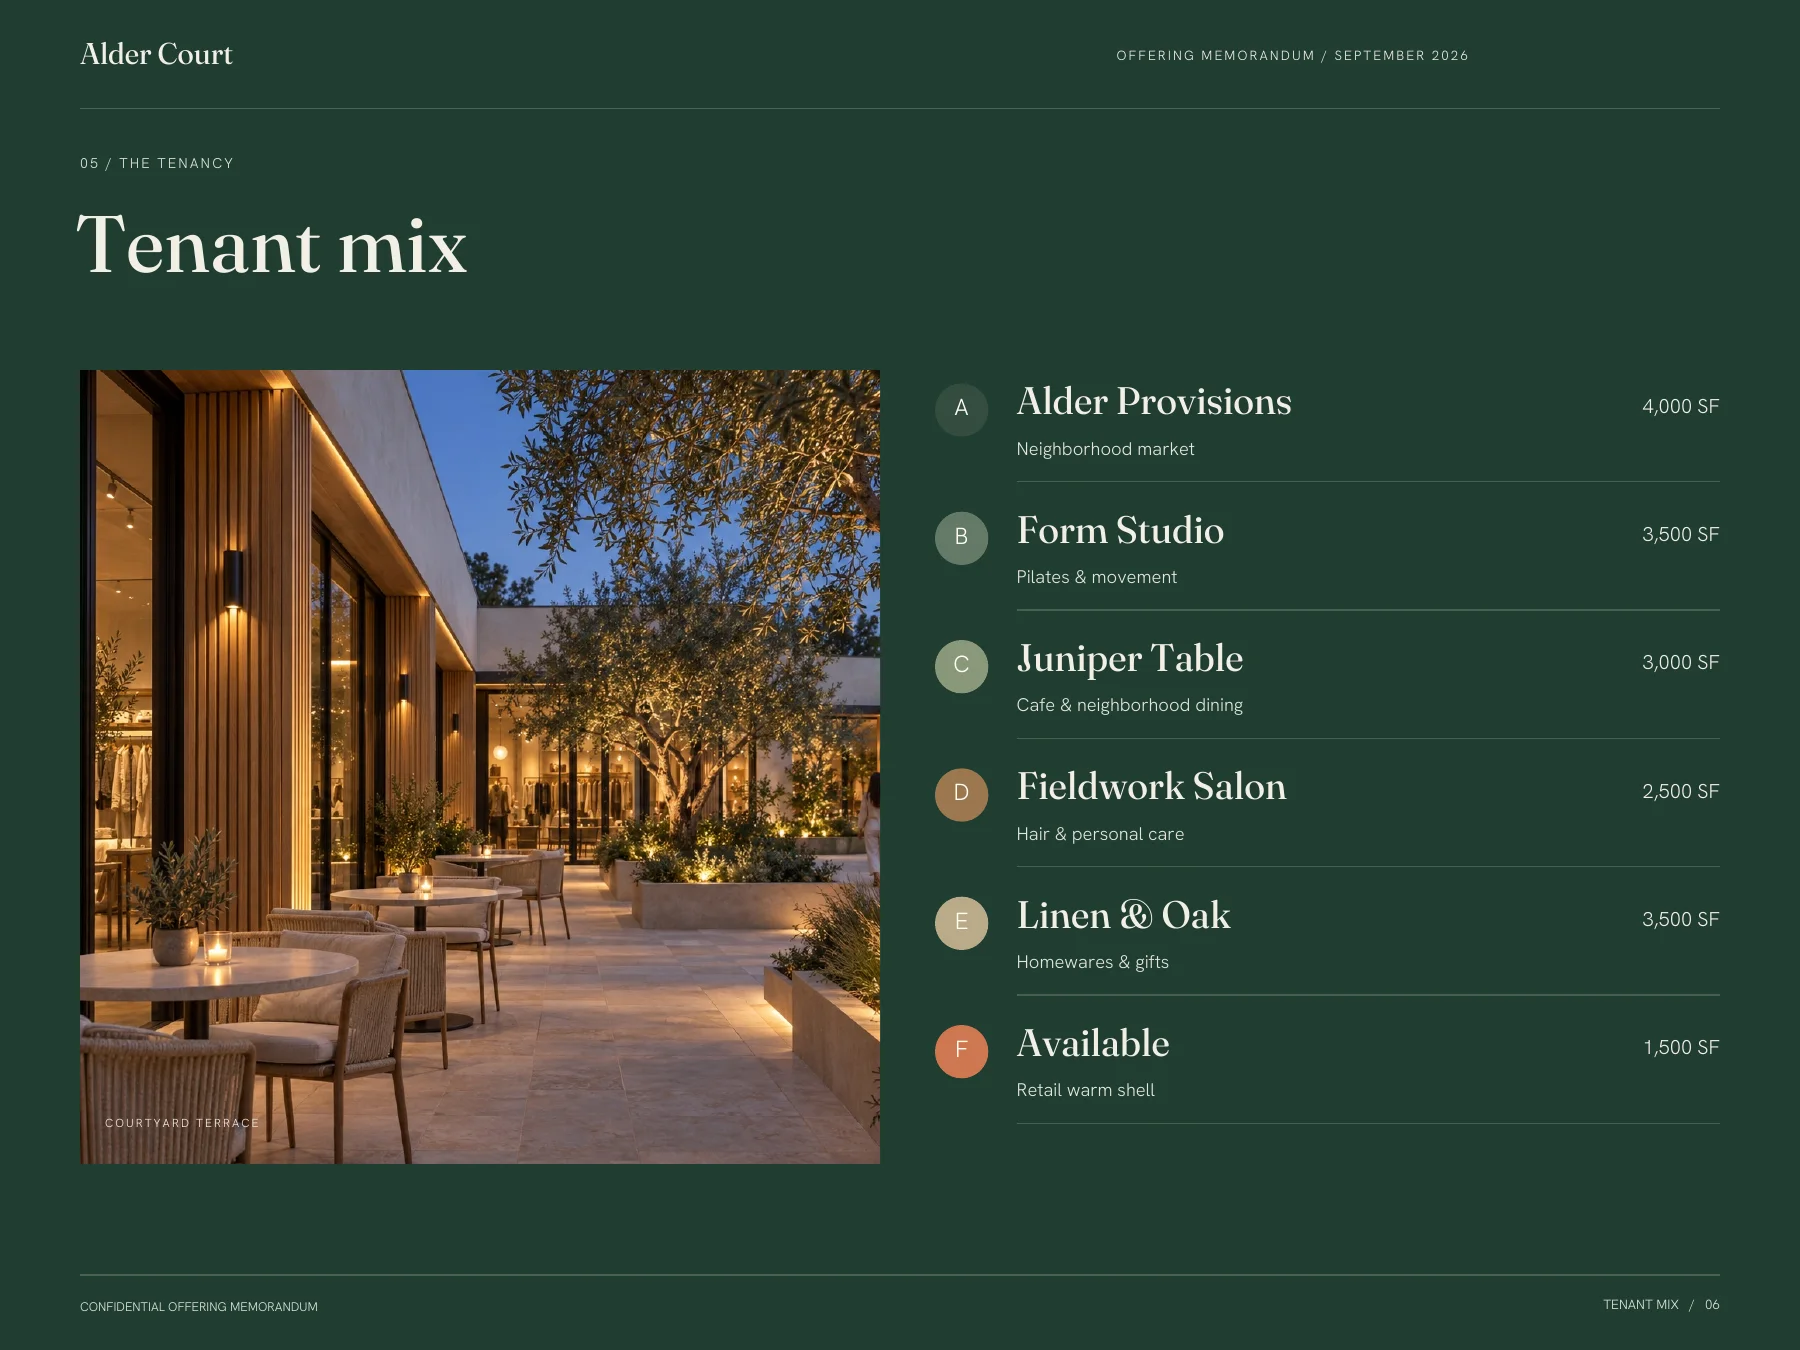
Page 07 / 12
Rent roll
Make the lease information readable.
The rent roll lists suite, tenant, area, annual rent per square foot, monthly rent, annual rent, and lease dates. The occupied leases total $43,500 per month and $522,000 per year in base rent.
Annual base rent excludes reimbursements. The vacant suite has no current rent; its potential income appears separately.
Open page 7 in the PDF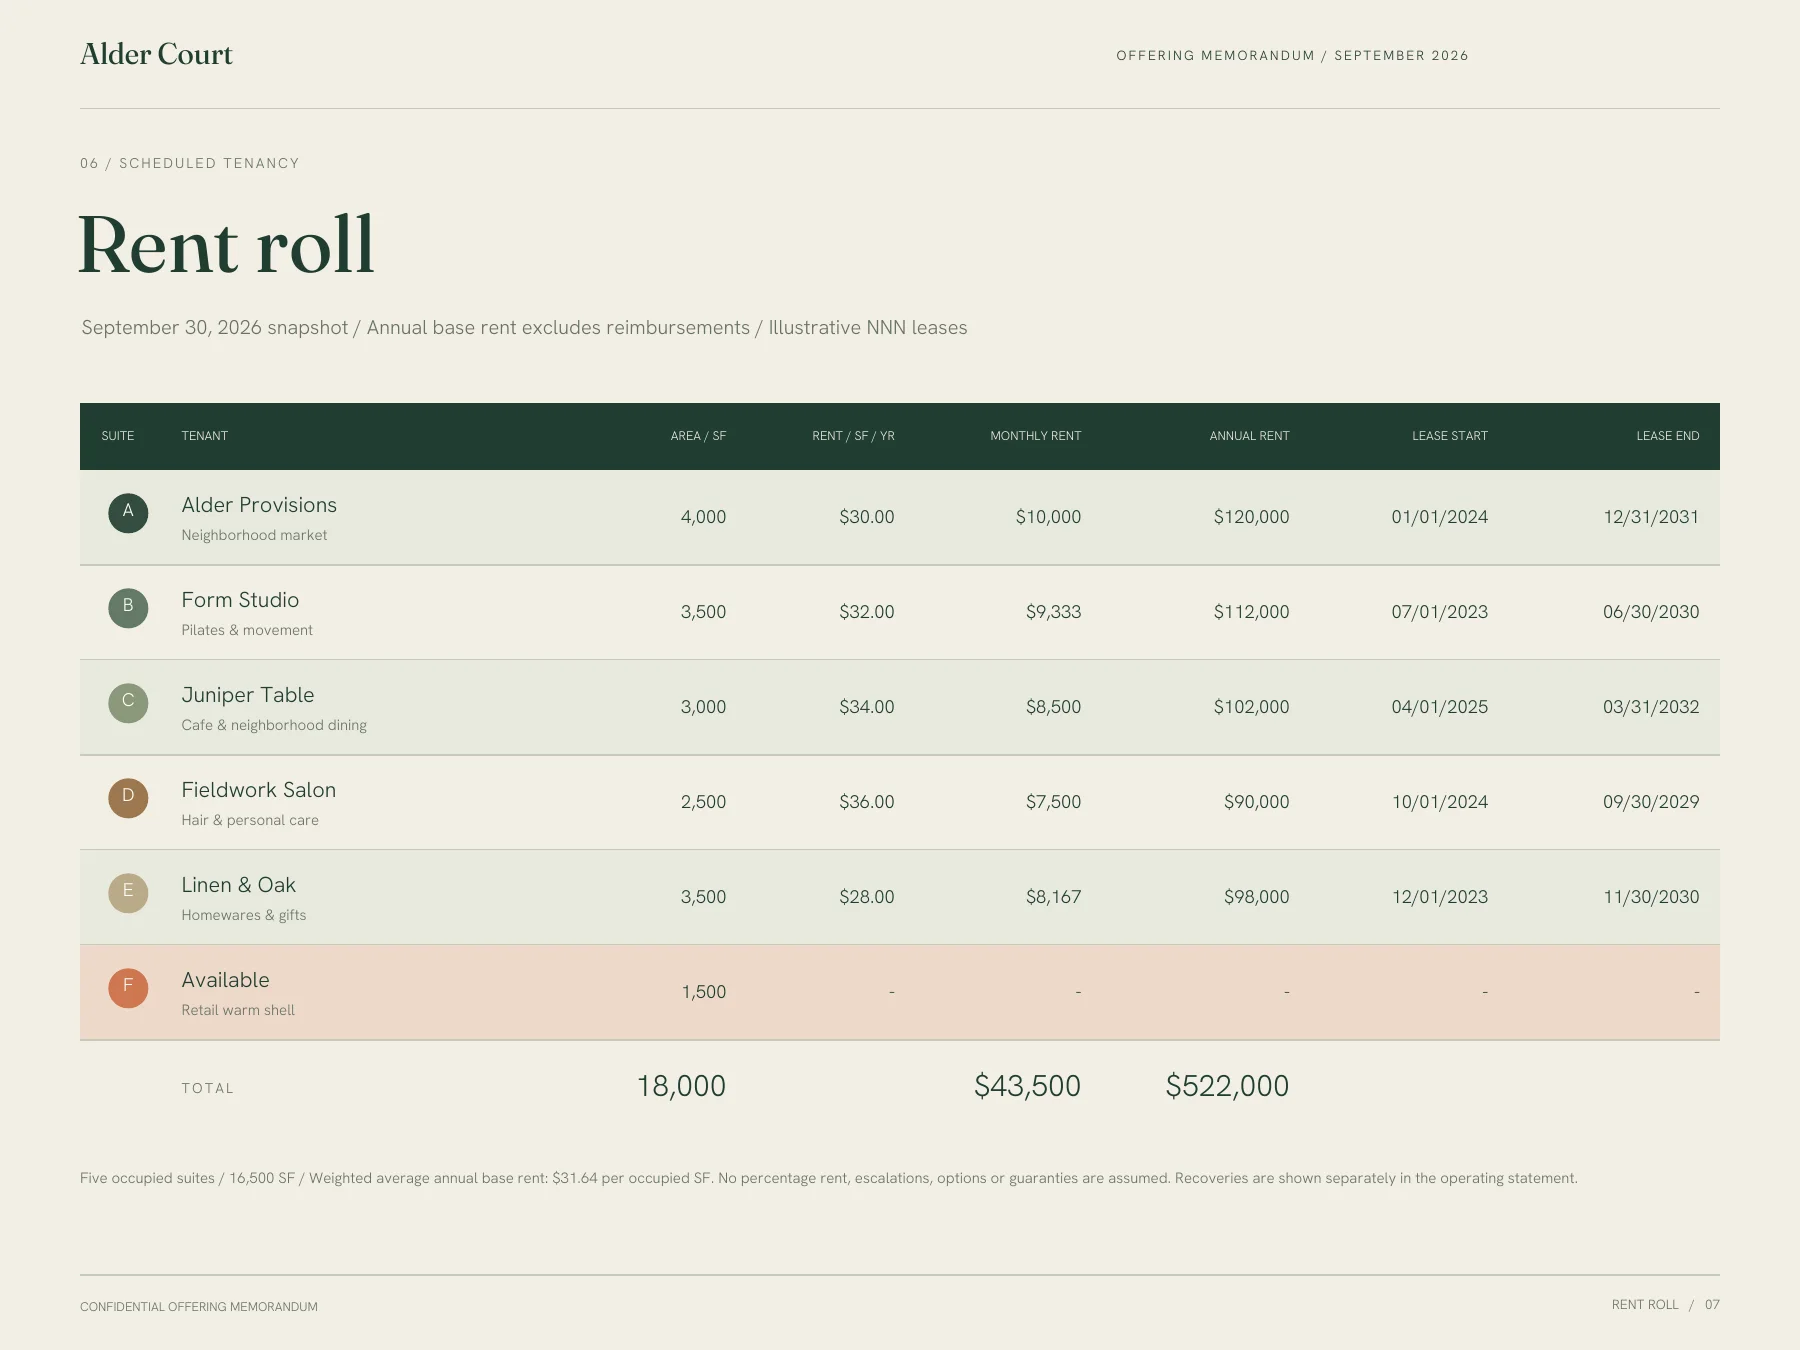
Page 08 / 12
Rent concentration & expirations
Show where the income sits.
Two charts summarize the share of base rent by tenant and the area expiring by year. They are calculated from the same lease schedule shown on the previous page.
Charts should reveal the structure of the rent roll, with labels and units that can be checked against the table.
Open page 8 in the PDF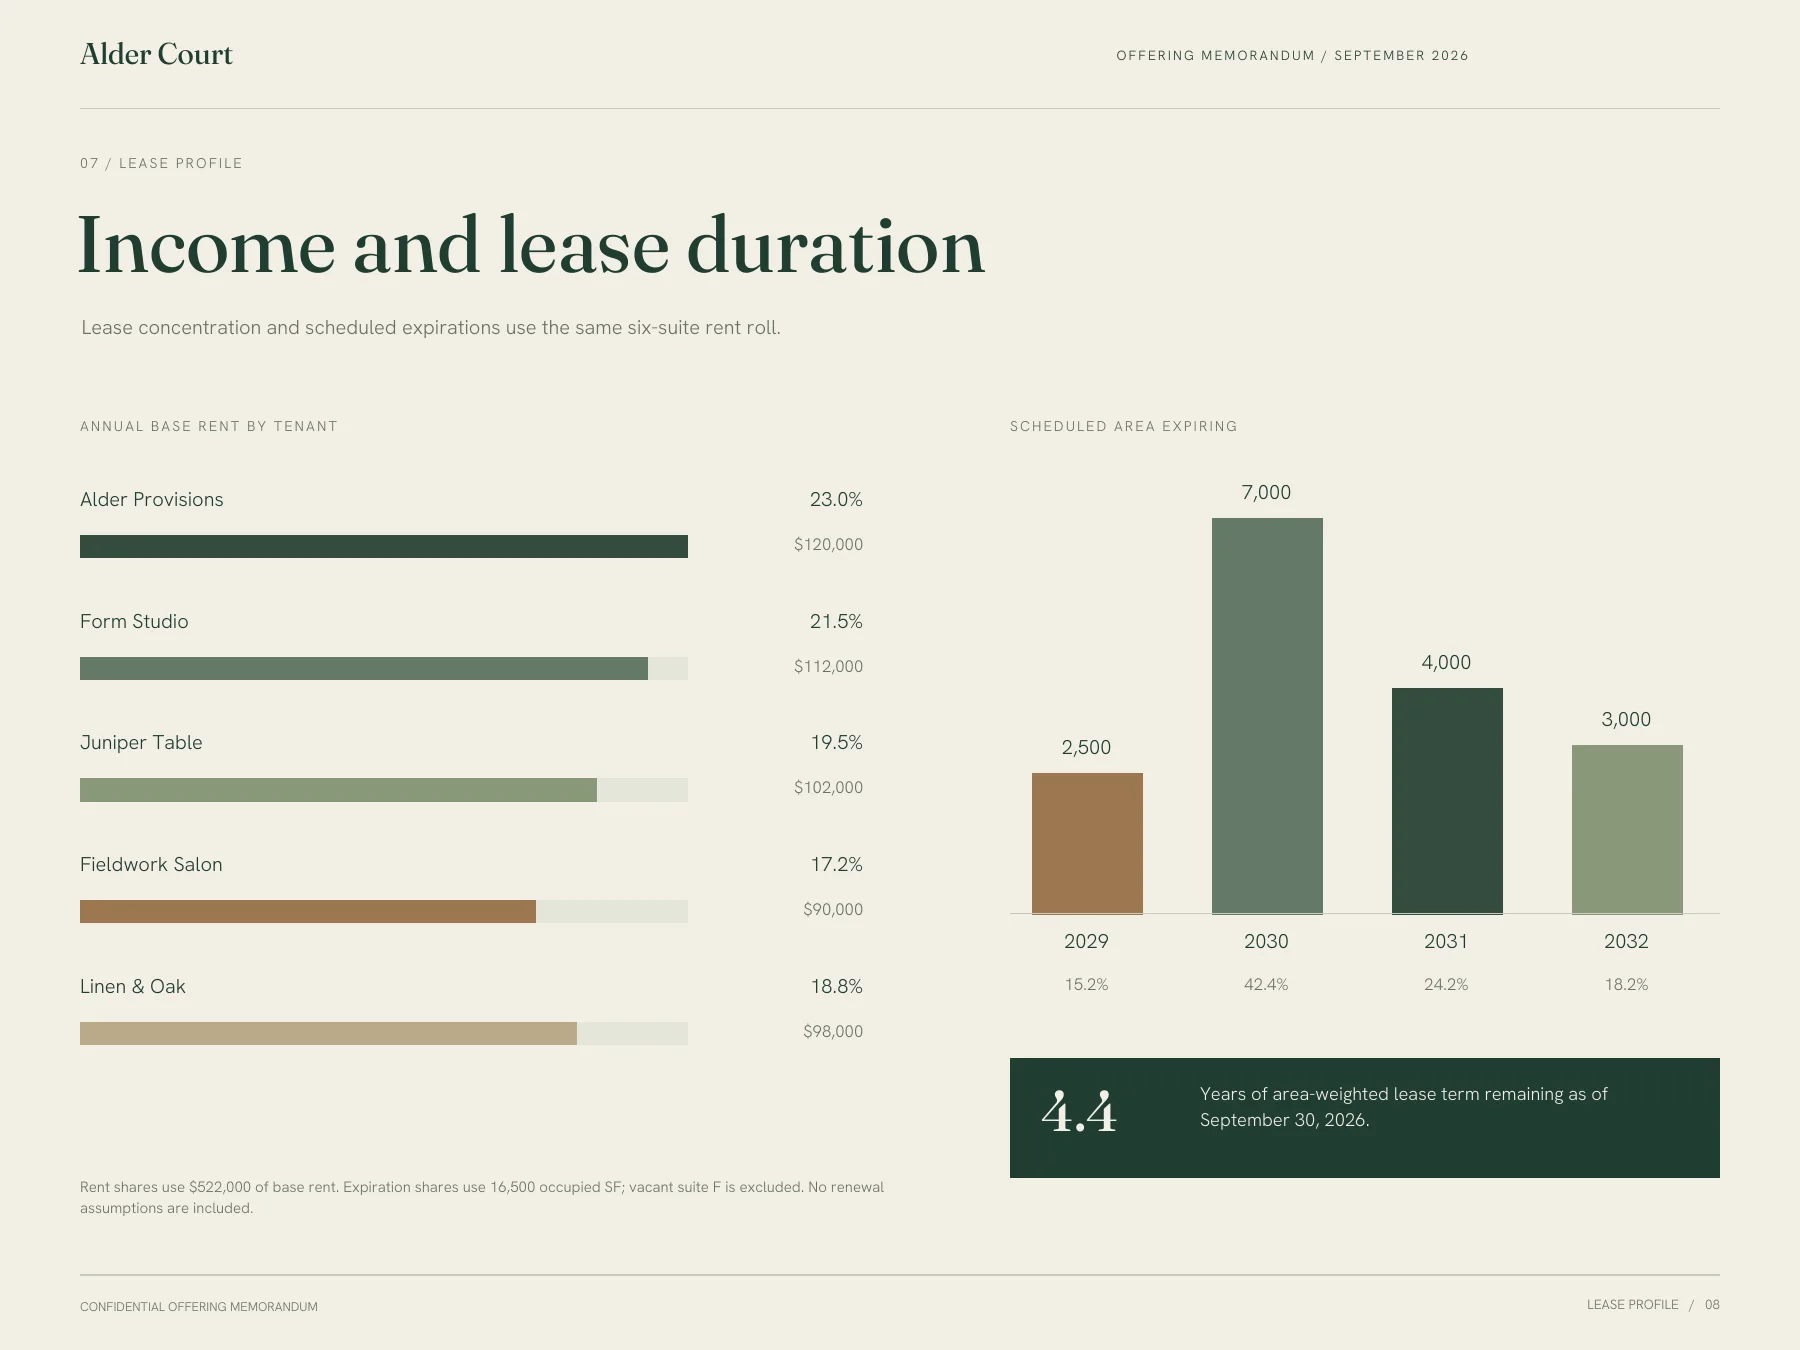
Page 09 / 12
Operating statement
Make the route to NOI visible.
Base rent, recoveries, other income, a collection allowance, and operating expenses lead to the $446,000 NOI. Expense categories are listed rather than hidden behind one unexplained total.
The owner or analyst supplies and approves the statement.
Open page 9 in the PDF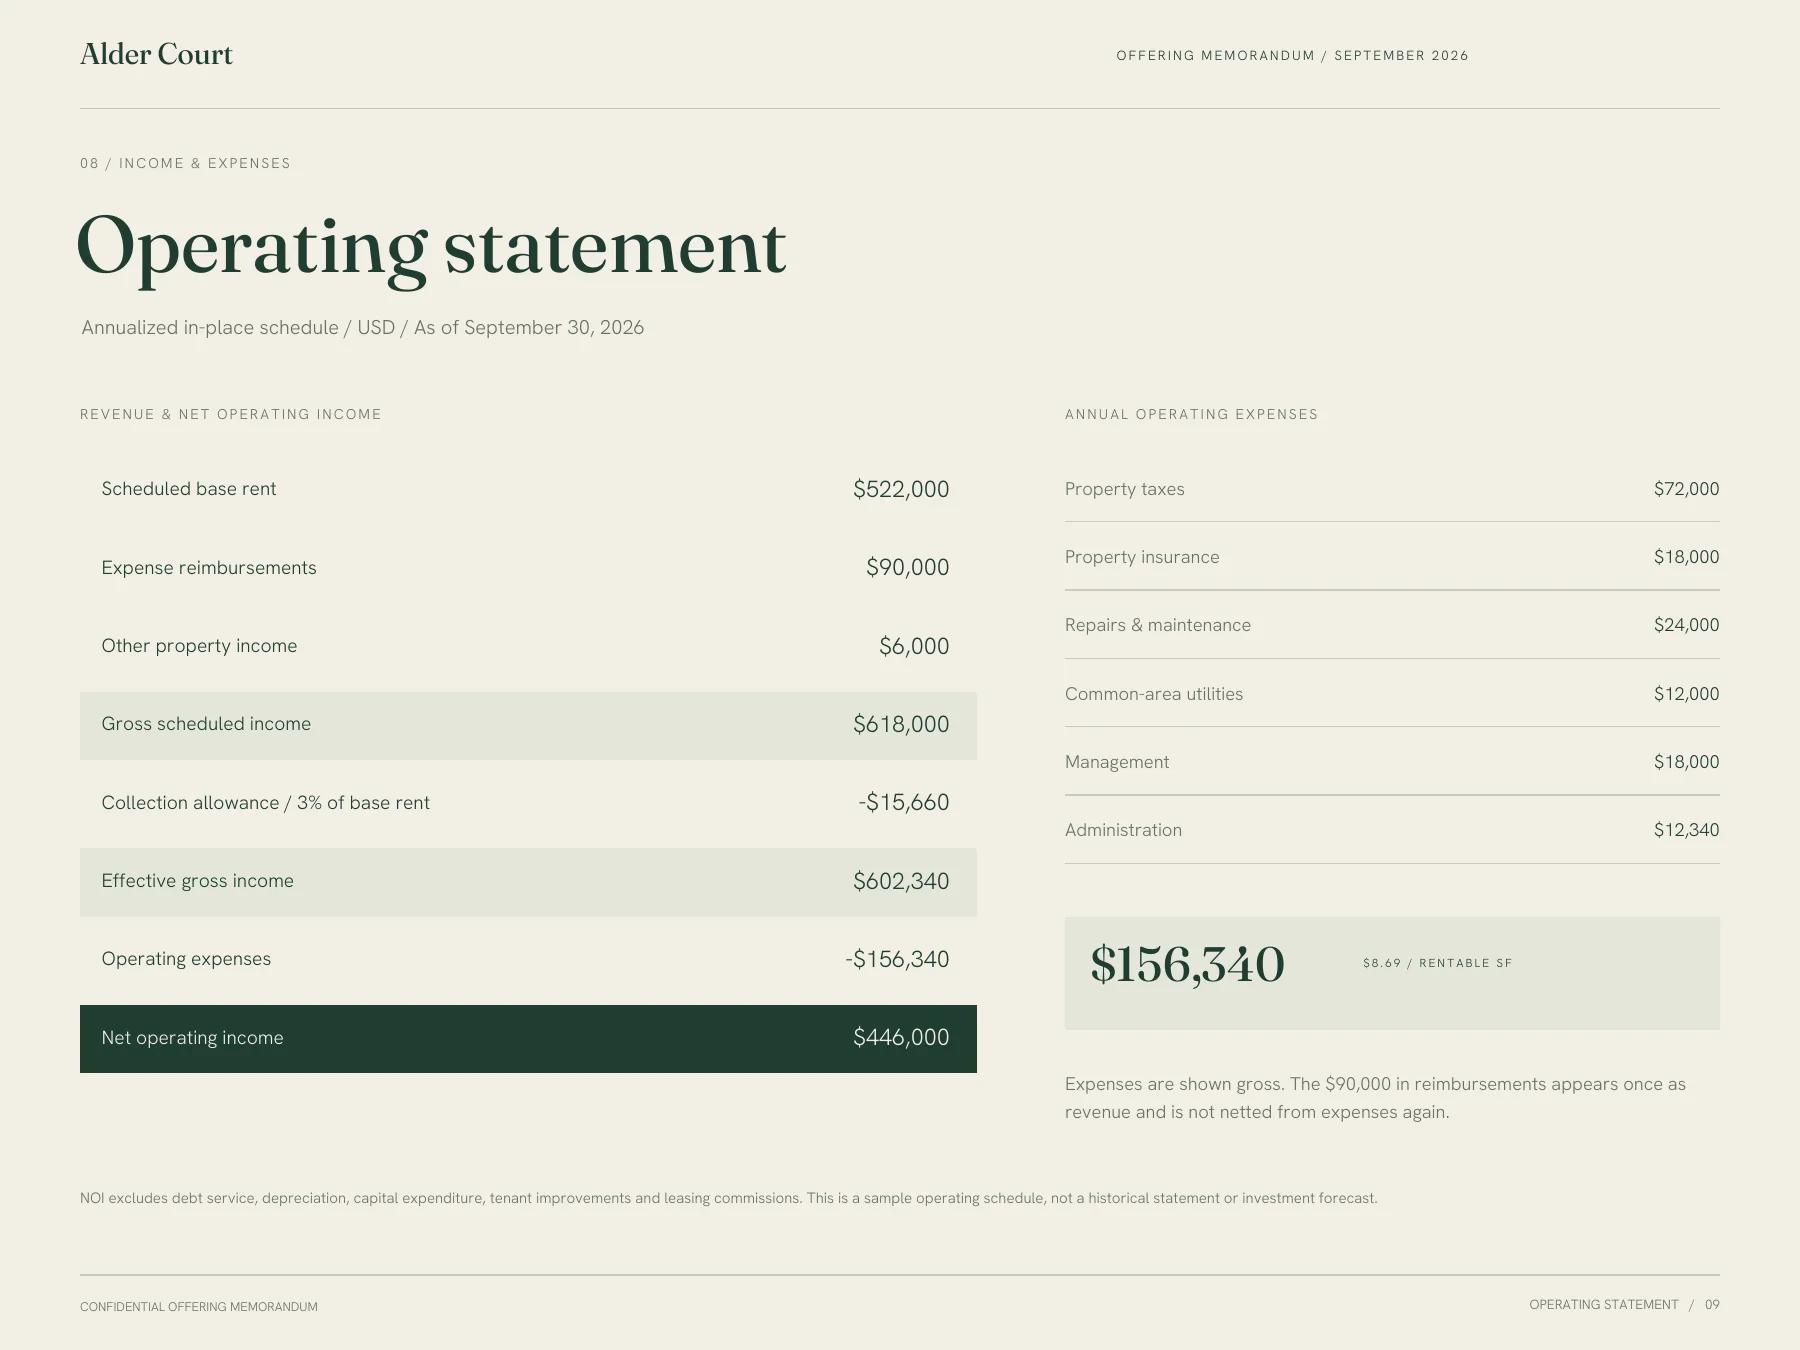
Page 10 / 12
Vacancy & lease-up
Separate current income from a scenario.
The 1,500 SF vacancy is paired with an interior image. The lease-up scenario assumes $32 per SF in annual base rent and shows the additional income, expenses, tenant improvements, and leasing commission.
The scenario reaches $499,302 NOI, with $81,900 in one-time leasing costs.
Open page 10 in the PDF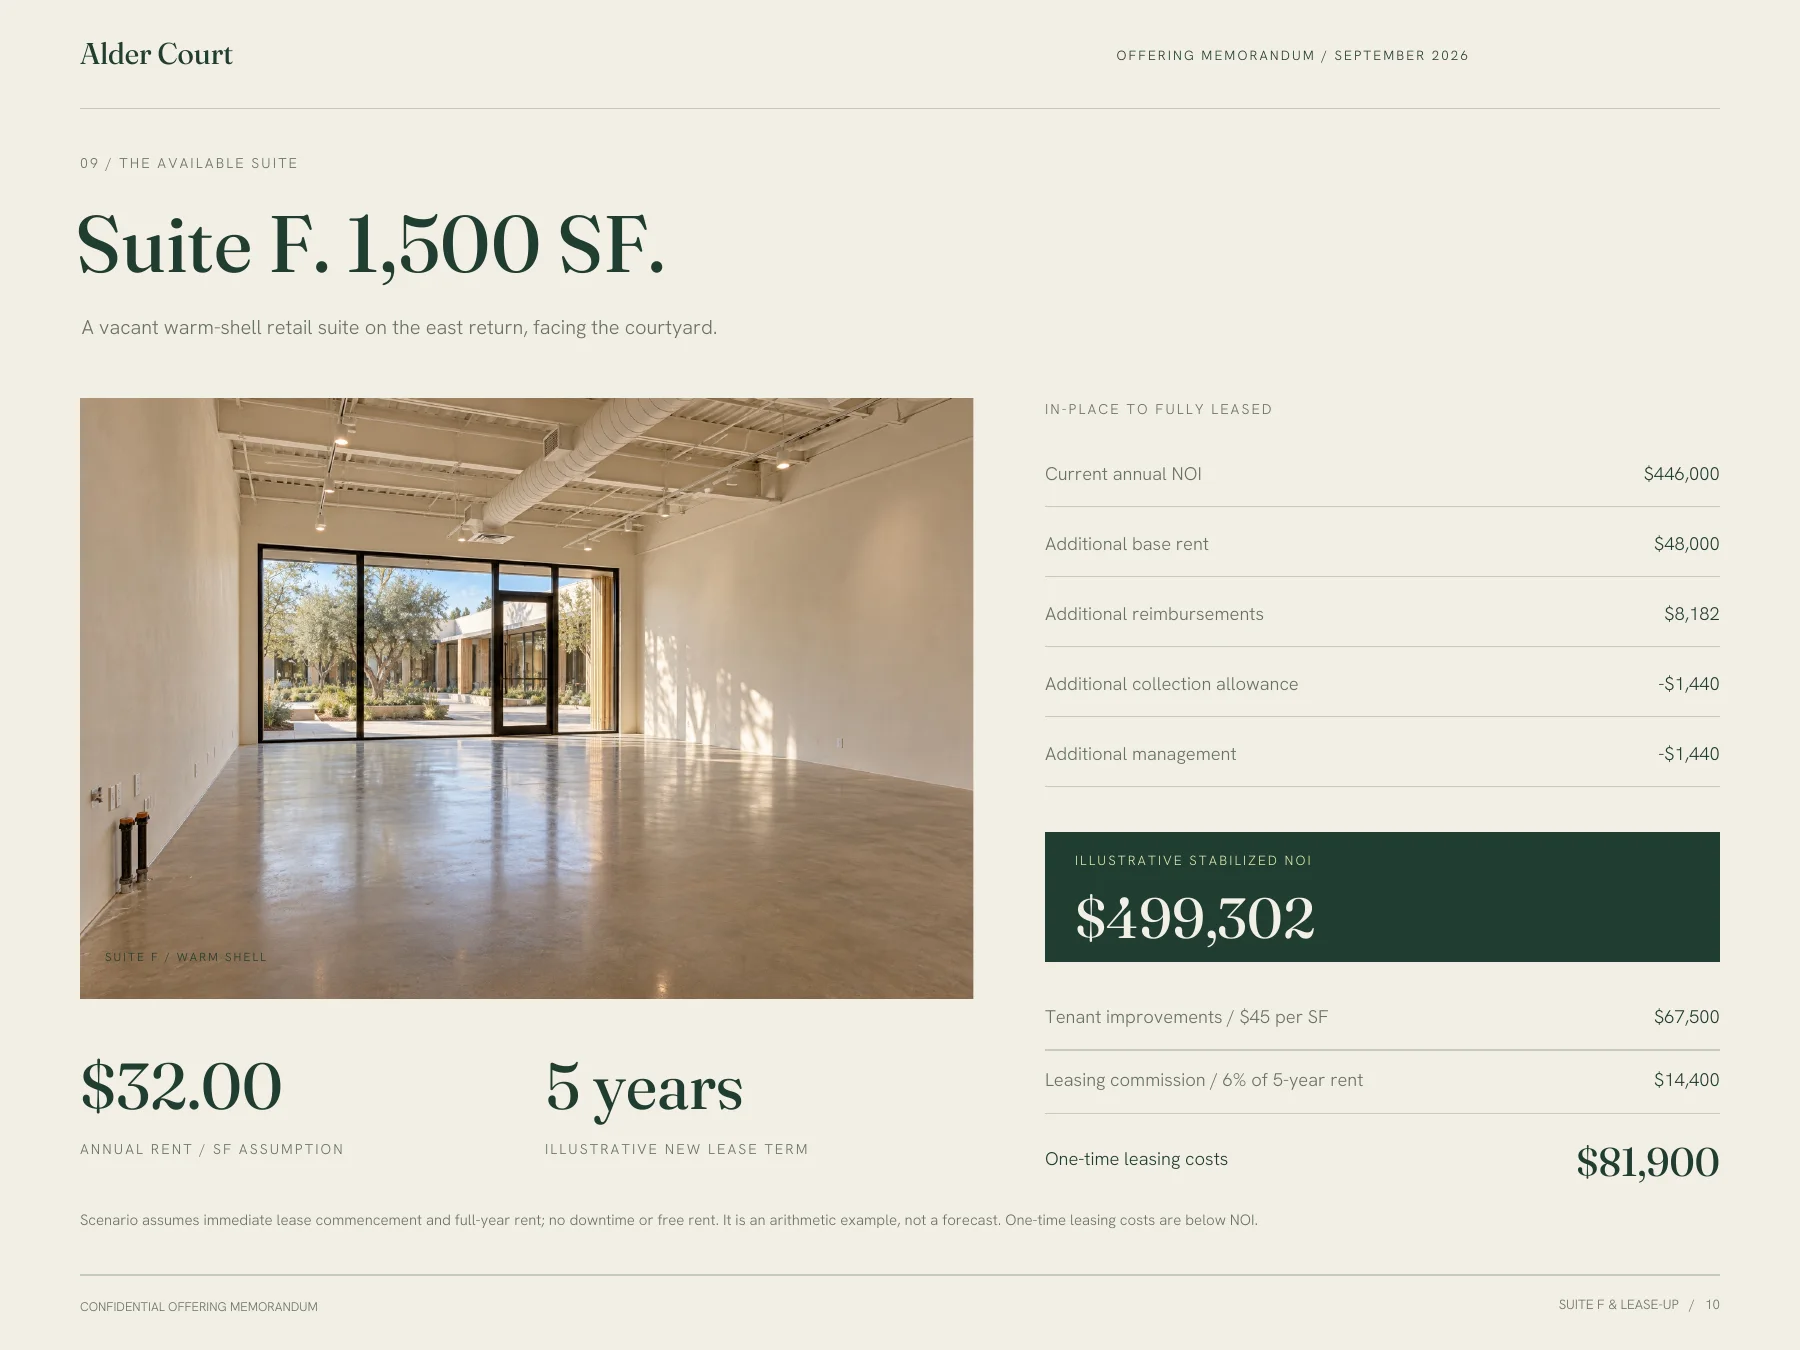
Page 11 / 12
Price sensitivity & assumptions
Let the reader inspect the assumptions.
The sensitivity page relates the stated income assumptions to different pricing and cap-rate scenarios. It gives the reader a way to compare outcomes while keeping the underlying inputs visible.
Label the current scenario, the modeled scenario, and the basis of every percentage. A presentation does not replace underwriting.
Open page 11 in the PDF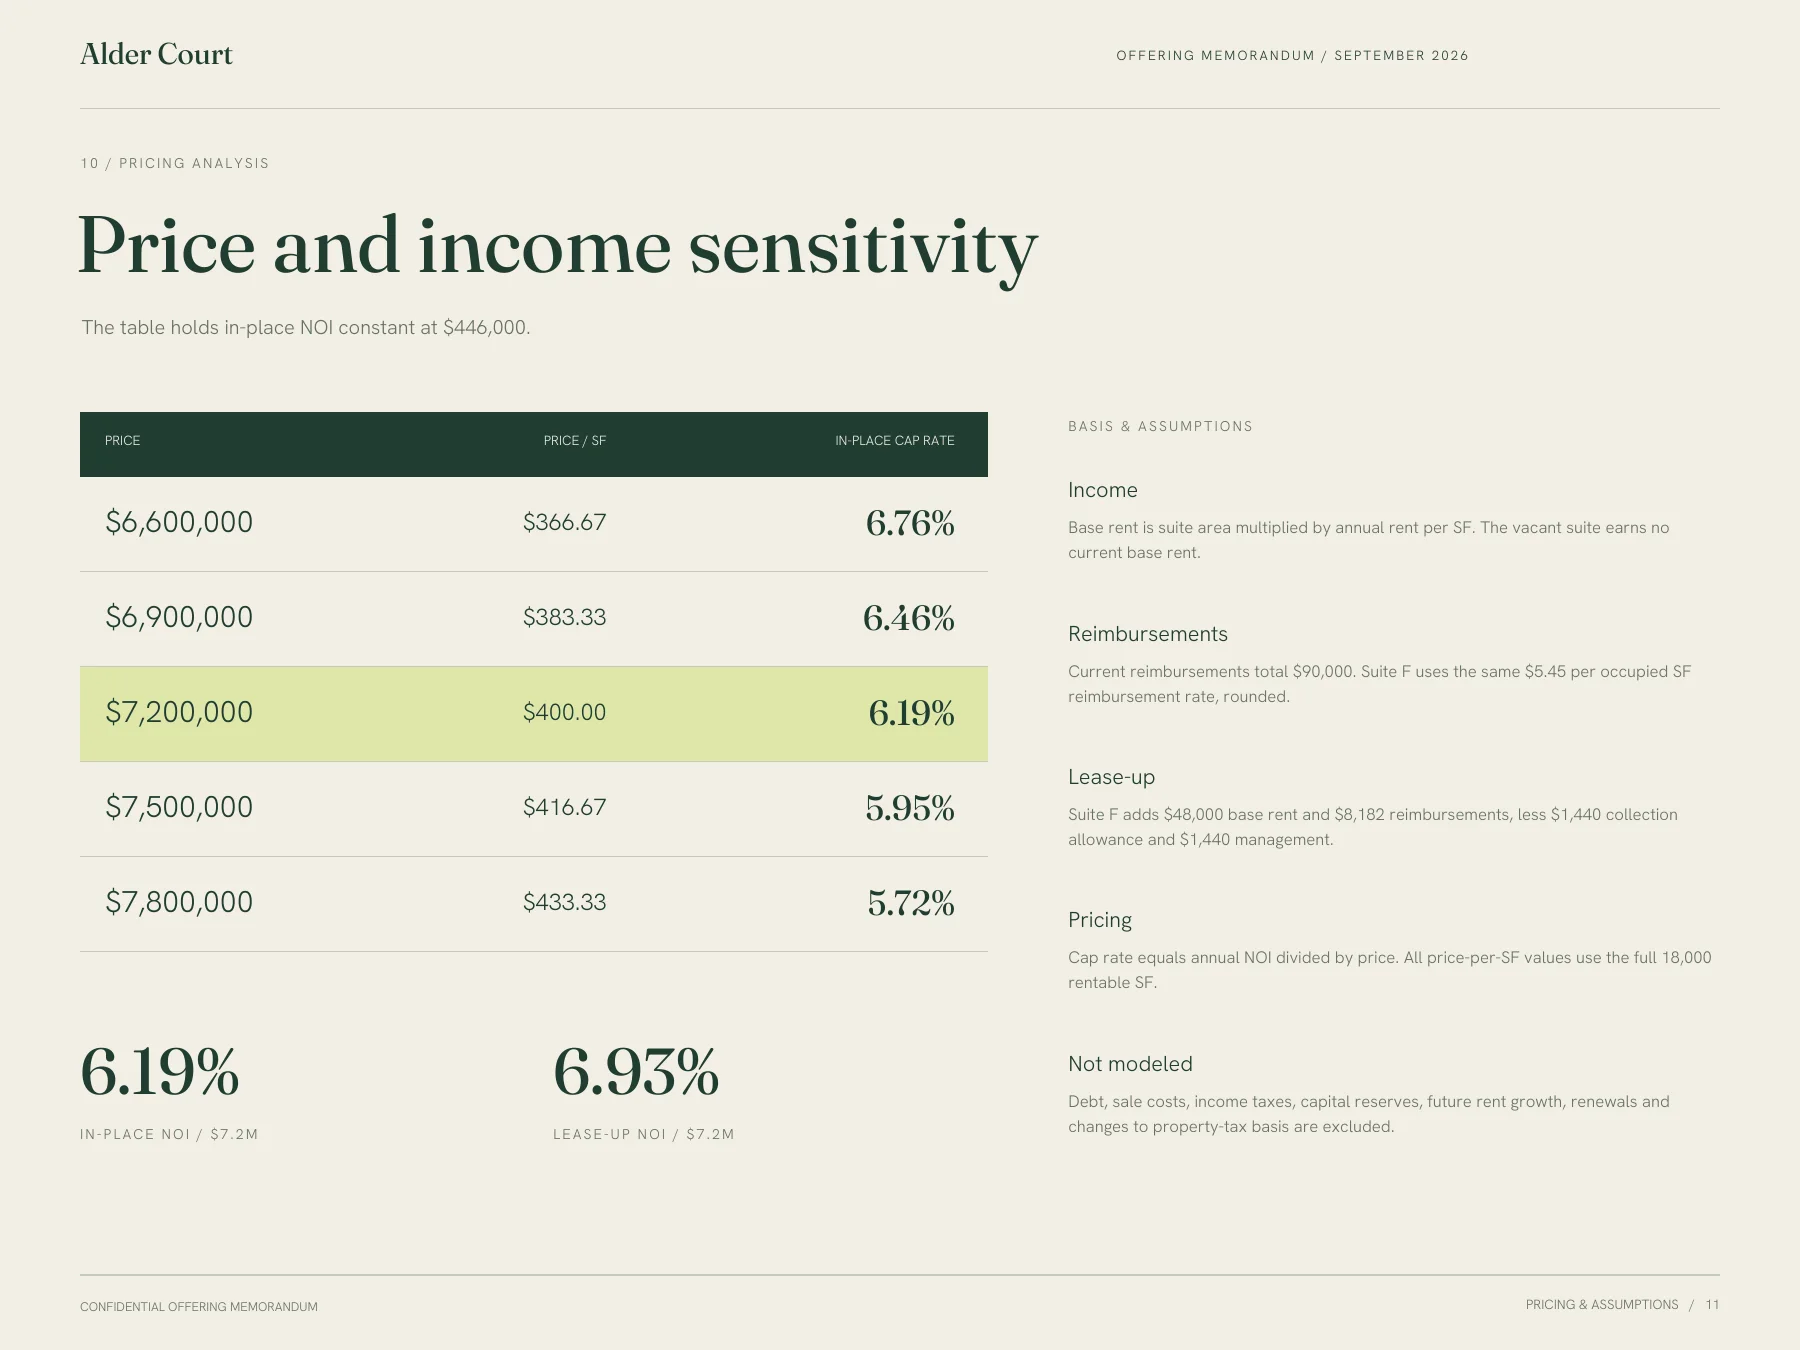
Page 12 / 12
Contact
Finish with the right contact.
The closing page summarizes the document and gives the contact for document design.
A live offering would carry the listing broker’s contact and the brokerage’s approved disclosure language.
Open page 12 in the PDF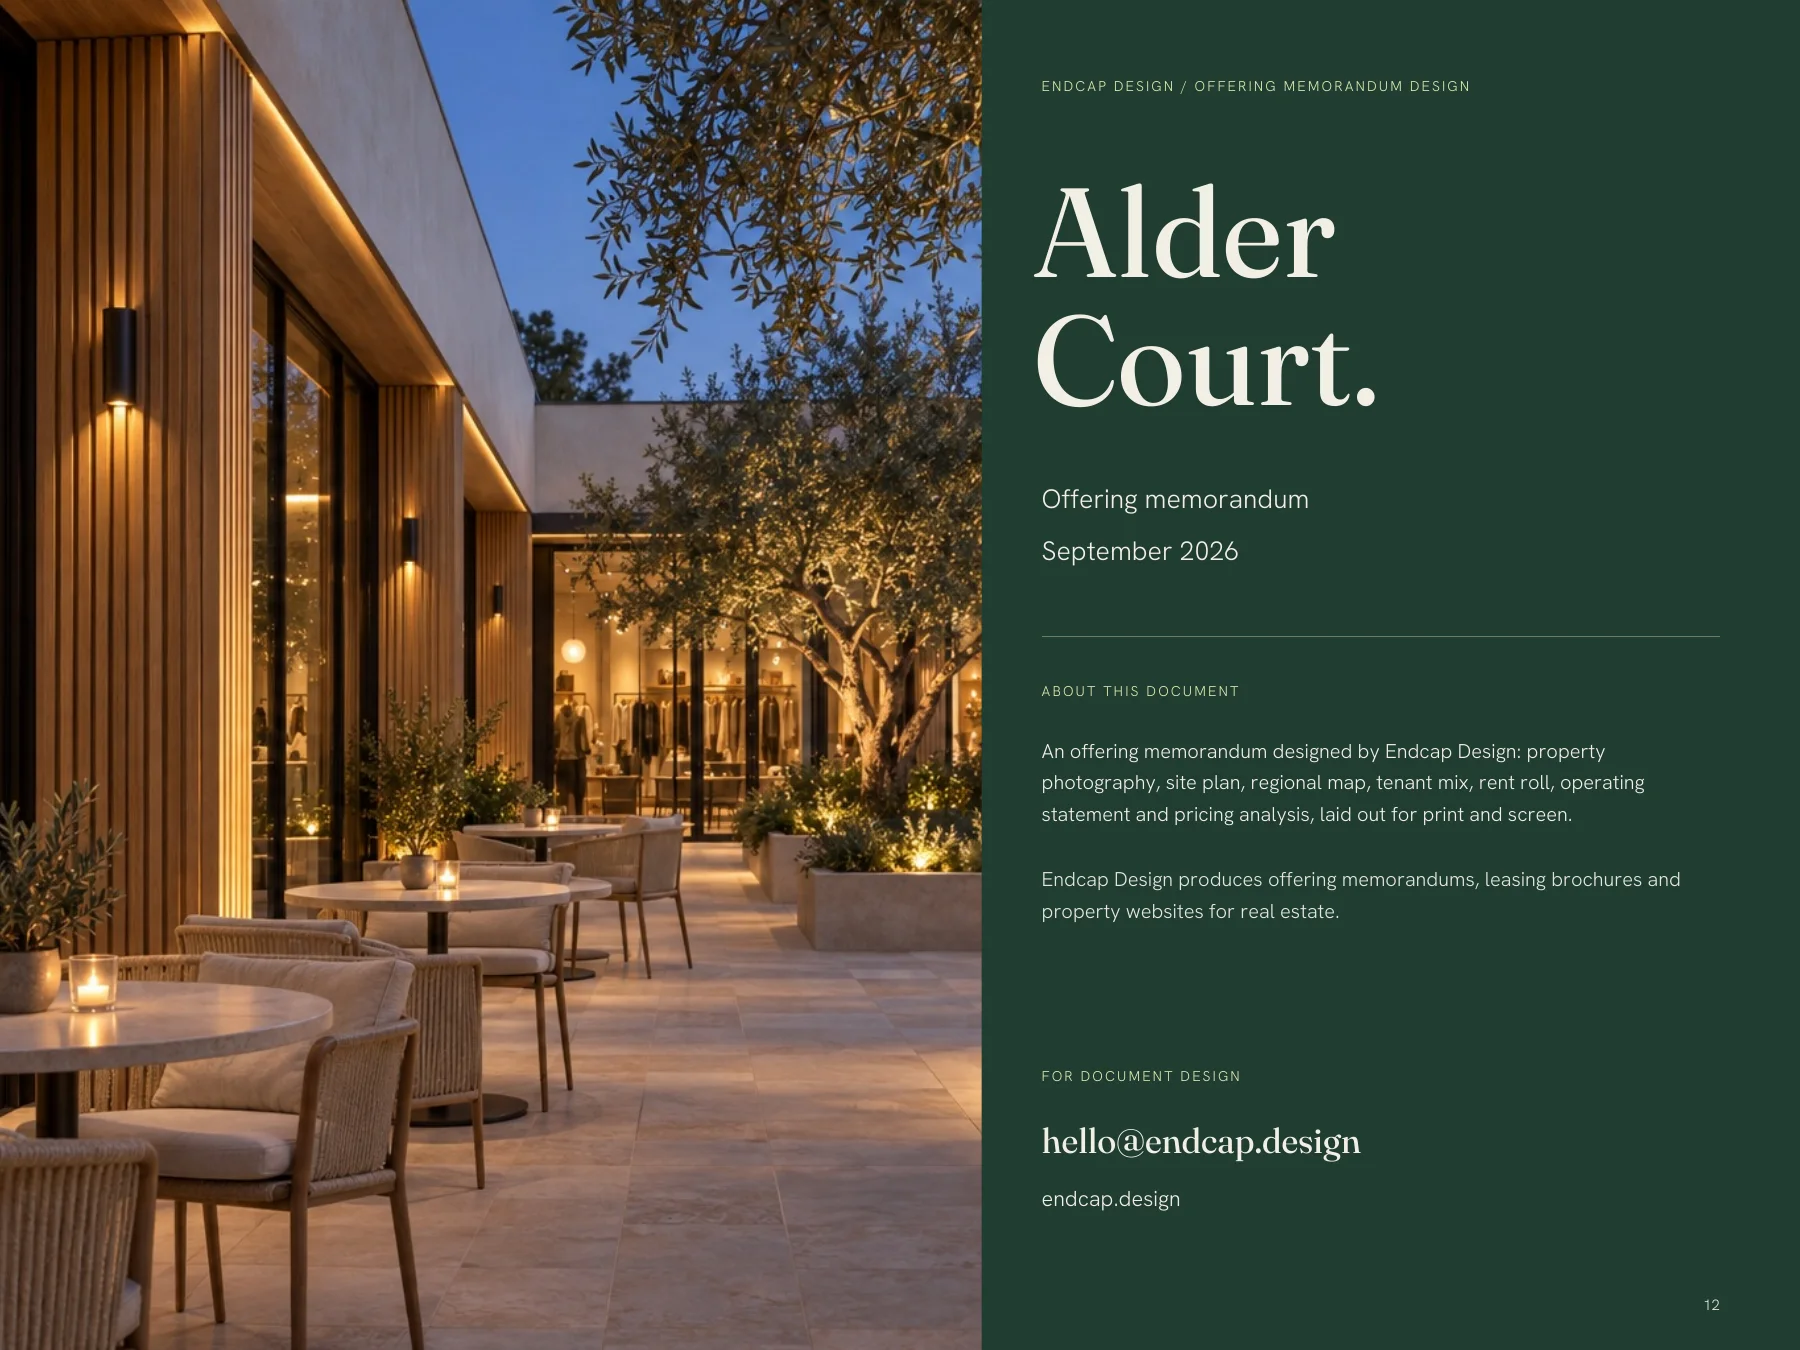
Your property / Your information
Have an OM to prepare?
Send the property information, approved figures, photography, and any brokerage template. We agree on the pages, design scope, review rounds, and price before starting.
See OM scope and pricing Discuss a documentWork with Endcap Design
Offering memorandum design
We design offering memorandums, property brochures, and lease flyers from your approved text, photos, plans, rent roll, and financials.
Included
- Up to 12 pages using your approved text, photos, tables, and financials
- Two revision rounds
- Digital and print-ready PDFs
“The Flyer is all that I need and it is outstanding.”
Offering memorandums from $495 for up to 12 pages · Brochures from $350 · Lease flyers from $175
We agree on the scope, timing, and price with you before work begins.
Get a quote for your OMOr call or text (425) 233-0769
See the full service ↗Contact Endcap
START A
project.
A website, a brochure, or a complete set of materials.
We’ll agree on the scope, timing, and price before starting.
Start a conversation or call or text (425) 233-0769